Kafka topic-level access mapping
With its Kafka watcher enabled, the network mapper allows you to map topic-level access to Kafka servers within your Kubernetes cluster. This provides a clear picture of which Kafka topics are being accessed and with which operations. In this tutorial, we will:
- Deploy a Kafka broker, and two clients that call it.
- Discover which topics are being accessed by those clients, and with which operations, using the Otterize network mapper's Kafka watcher.
We will not be doing any access control in this demo, just purely mapping client-to-Kafka access at the topic and operation level.
Prerequisites
Already have Otterize & a Kafka broker deployed on your cluster? Skip to the tutorial.
1. Deploy Otterize
To deploy Otterize, head over to Otterize Cloud and associate a Kubernetes cluster on the Integrations page, and follow the instructions. If you already have a Kubernetes cluster connected, skip this step.
Note:
Copy the Helm command and add the following flags:
--set networkMapper.kafkawatcher.enable=true \
--set networkMapper.kafkawatcher.kafkaServers={"kafka-0.kafka"}
2. Install Kafka
We will deploy a Kafka broker using Bitnami's Helm chart. In the chart we will configure Kafka to:
- Recognize the Otterize intents operator as a super user so it can configure ACLs.
- Turn on Kafka debug logging to allow the Kafka watcher to feed topic-level client access information to the network mapper.
Expand to see the Helm values.yaml used with the Bitnami chart
listeners:
  - "CLIENT://:9092"
  - "INTERNAL://:9093"
advertisedListeners:
  - "CLIENT://:9092"
  - "INTERNAL://:9093"
# For a gradual rollout scenario we will want to keep the default permission for topics as allowed, unless an ACL was set
allowEveryoneIfNoAclFound: true
# Allocate resources
resources:
  requests:
    cpu: 50m
    memory: 256Mi
log4j: |
  # Unspecified loggers and loggers with additivity=true output to server.log and stdout
  # Note that INFO only applies to unspecified loggers, the log level of the child logger is used otherwise

  log4j.rootLogger=INFO, stdout, kafkaAppender

  log4j.appender.stdout=org.apache.log4j.ConsoleAppender
  log4j.appender.stdout.layout=org.apache.log4j.PatternLayout
  log4j.appender.stdout.layout.ConversionPattern=[%d] %p %m (%c)%n

  log4j.appender.kafkaAppender=org.apache.log4j.ConsoleAppender
  log4j.appender.kafkaAppender.layout=org.apache.log4j.PatternLayout
  log4j.appender.kafkaAppender.layout.ConversionPattern=[%d] %p %m (%c)%n

  log4j.appender.stateChangeAppender=org.apache.log4j.ConsoleAppender
  log4j.appender.stateChangeAppender.layout=org.apache.log4j.PatternLayout
  log4j.appender.stateChangeAppender.layout.ConversionPattern=[%d] %p %m (%c)%n

  log4j.appender.requestAppender=org.apache.log4j.ConsoleAppender
  log4j.appender.requestAppender.layout=org.apache.log4j.PatternLayout
  log4j.appender.requestAppender.layout.ConversionPattern=[%d] %p %m (%c)%n

  log4j.appender.cleanerAppender=org.apache.log4j.ConsoleAppender
  log4j.appender.cleanerAppender.layout=org.apache.log4j.PatternLayout
  log4j.appender.cleanerAppender.layout.ConversionPattern=[%d] %p %m (%c)%n

  log4j.appender.controllerAppender=org.apache.log4j.ConsoleAppender
  log4j.appender.controllerAppender.layout=org.apache.log4j.PatternLayout
  log4j.appender.controllerAppender.layout.ConversionPattern=[%d] %p %m (%c)%n

  log4j.appender.authorizerAppender=org.apache.log4j.ConsoleAppender
  log4j.appender.authorizerAppender.layout=org.apache.log4j.PatternLayout
  log4j.appender.authorizerAppender.layout.ConversionPattern=[%d] %p %m (%c)%n


  # Change the line below to adjust ZK client logging
  log4j.logger.org.apache.zookeeper=INFO

  # Change the two lines below to adjust the general broker logging level (output to server.log and stdout)
  log4j.logger.kafka=INFO, stdout
  log4j.logger.org.apache.kafka=INFO

  # Change to DEBUG or TRACE to enable request logging
  log4j.logger.kafka.request.logger=WARN, requestAppender
  log4j.additivity.kafka.request.logger=false

  # Uncomment the lines below and change log4j.logger.kafka.network.RequestChannel$ to TRACE for additional output
  # related to the handling of requests
  #log4j.logger.kafka.network.Processor=TRACE, requestAppender
  #log4j.logger.kafka.server.KafkaApis=TRACE, requestAppender
  #log4j.additivity.kafka.server.KafkaApis=false
  log4j.logger.kafka.network.RequestChannel$=WARN, requestAppender
  log4j.additivity.kafka.network.RequestChannel$=false

  # Change the line below to adjust KRaft mode controller logging
  log4j.logger.org.apache.kafka.controller=INFO, controllerAppender
  log4j.additivity.org.apache.kafka.controller=false

  # Change the line below to adjust ZK mode controller logging
  log4j.logger.kafka.controller=TRACE, controllerAppender
  log4j.additivity.kafka.controller=false

  log4j.logger.kafka.log.LogCleaner=INFO, cleanerAppender
  log4j.additivity.kafka.log.LogCleaner=false

  log4j.logger.state.change.logger=INFO, stateChangeAppender
  log4j.additivity.state.change.logger=false

  # Access denials are logged at INFO level, change to DEBUG to also log allowed accesses
  log4j.logger.kafka.authorizer.logger=DEBUG, authorizerAppender
  log4j.additivity.kafka.authorizer.logger=false
authorizerClassName: kafka.security.authorizer.AclAuthorizer
The following command will deploy a Kafka broker with this chart:
helm repo add otterize https://helm.otterize.com
helm repo update
helm install --create-namespace -n kafka \
  -f https://docs.otterize.com/code-examples/kafka-mapping/helm/values.yaml kafka otterize/kafka --version 21.4.4
Tutorial
Deploy demo to simulate traffic
Let's add a few workloads that will access our Kafka server, and see how the network mapper builds the access map:
- One workload named "client".
- One workload named "client-2".
To deploy these workloads, use:
kubectl apply -n otterize-tutorial-kafka-mapping -f https://docs.otterize.com/code-examples/kafka-mapping/all.yaml
Each of these workloads is built to periodically call the Kafka broker we deployed. Because that broker has the Otterize OSS Kafka watcher enabled and feeding data to the network mapper, we can query the network mapper directly to see the map it has built up.
otterize network-mapper list -n otterize-tutorial-kafka-mapping
We expect to see:
clientconsuming frommytopic.client-2producing tomytopic.
And indeed:
client in namespace otterize-tutorial-kafka-mapping calls:
  - kafka in namespace kafka
    - Kafka topic: transactions, operations: [describe]
    - Kafka topic: mytopic, operations: [describe consume]
client-2 in namespace otterize-tutorial-kafka-mapping calls:
  - kafka in namespace kafka
    - Kafka topic: transactions, operations: [describe]
    - Kafka topic: mytopic, operations: [produce describe]
Go back to see the access graph in your browser.
To only see Kafka information, In order to see only the connection relevant to Kafka, you can filter by namespace (at the top of the access graph) and select only the Kafka layer:
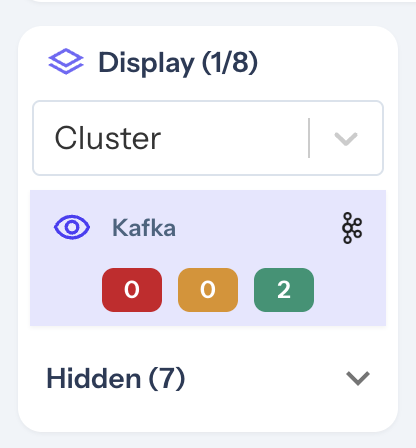
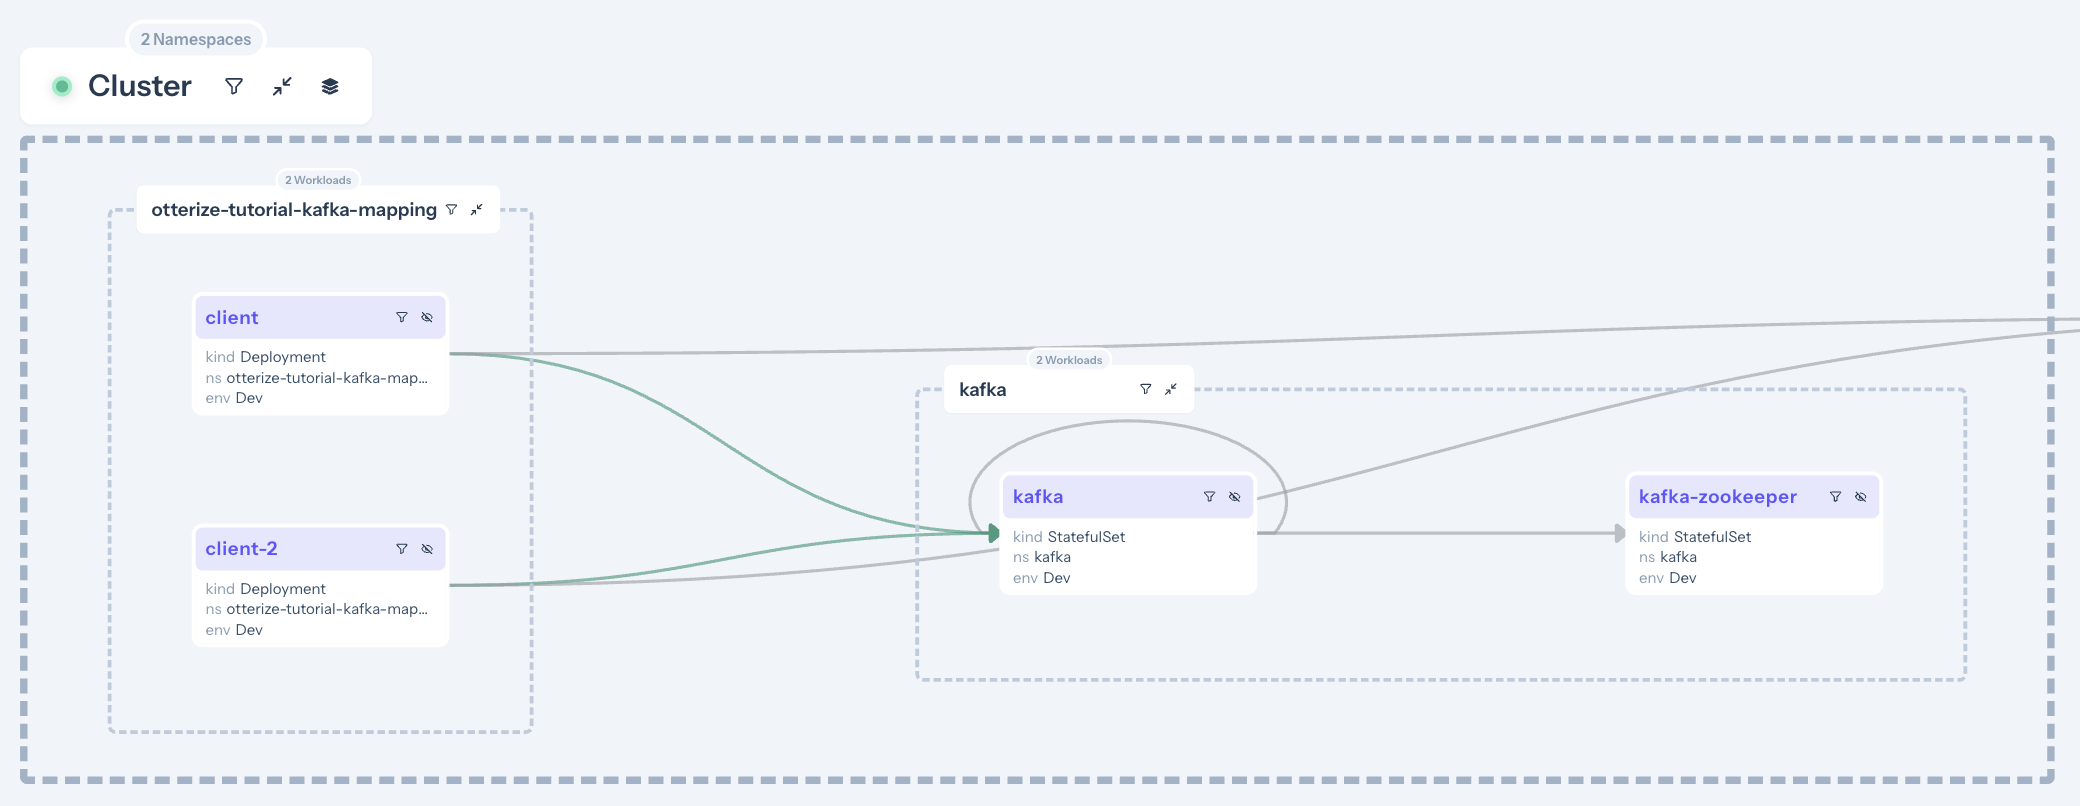 Only the arrows between the clients and the Kafka are green, because we've selected Kafka ACLs for access graph. The other arrows were detected through network mapping, but since there's no Kafka mapping for those arrows, they are grayed out.
Clicking on a specific arrow between a client and the broker reveals which topic and operations are being accessed.
What did we accomplish?
Enabling the Kafka watcher component of the network mapper shows which clients connect to running Kafka servers, the topics they access, and the operations they undertake on those topics.
You can consume this information in various ways:
- Visually via the access graph, where shadow mode shows you what would in enforcement mode before actually turning on enforcement, and auto-generating client intents to bootstrap rolling out IBAC.
- Via the CLI: from the network mapper directly or the cloud.
- Via the API.
What's next
- Try our secure access for Kafka tutorial
Teardown
To remove the deployed examples run:
helm uninstall otterize -n otterize-system
helm uninstall kafka -n kafka
kubectl delete -f https://docs.otterize.com/code-examples/kafka-mapping/all.yaml