Istio HTTP-level access mapping
With its Istio watcher enabled, the network mapper allows you to map pod-to-pod Istio traffic within your K8s cluster.
In this tutorial, we will:
- Install the Istio service mesh in our cluster.
- Deploy 2 clients calling a server (in this case, an nginx reverse-proxy) over HTTP using different paths.
- Map their calls using the network mapper and its Istio watcher component.
Prerequisites
Already have Otterize deployed with Istio configured on your cluster? Skip to the tutorial.
1. Deploy Otterize
To deploy Otterize, head over to Otterize Cloud and associate a Kubernetes cluster on the Integrations page, and follow the instructions. If you already have a Kubernetes cluster connected, skip this step.
2. Install and configure Istio
Install Istio in the cluster via Helm
helm repo add istio https://istio-release.storage.googleapis.com/charts
helm repo update
helm install istio-base istio/base -n istio-system --create-namespace
helm install istiod istio/istiod -n istio-system --wait
Add HTTP methods and request paths to Istio exported metrics
Apply this configuration in the istio-system namespace, propagating it to all namespaces covered by the mesh.
kubectl apply -f https://docs.otterize.com/code-examples/network-mapper/istio-telemetry-enablement.yaml -n istio-system
apiVersion: telemetry.istio.io/v1alpha1
kind: Telemetry
metadata:
  name: mesh-default
  namespace: istio-system
spec:
  accessLogging:
    - providers:
        - name: envoy
  metrics:
    - providers:
        - name: prometheus
      overrides:
        - tagOverrides:
            request_method:
              value: request.method
            request_path:
              value: request.path
HTTP request paths and methods aren't exported in Envoy's connection metrics by default, but we do want to capture those details when creating the network map. That way we not only have better visibility of the calling patterns, e.g. in the access graph, but we can also use that information to automatically generate fine-grained intents and enforce them with Istio authorization policies.
Tutorial
Deploy demo to simulate traffic
Let's create a namespace with istio enabled, and add services and traffic to the cluster and see how the network mapper builds the map.
Deploy the following simple example — client, client2 and nginx, communicating over HTTP:
kubectl create namespace otterize-tutorial-istio-mapping
kubectl label namespace otterize-tutorial-istio-mapping istio-injection=enabled
kubectl apply -n otterize-tutorial-istio-mapping -f https://docs.otterize.com/code-examples/network-mapper/istio.yaml
Map the cluster
The Istio watcher component of the network mapper starts querying Envoy sidecars for HTTP connections and builds an in-memory network map as soon as it's installed. The Otterize CLI allows you to interact with the network mapper to grab a snapshot of current mapped traffic, reset its state, and more.
For a complete list of the CLI capabilities read the CLI command reference.
Extract and see the network map
You can get the network map by calling the CLI list or export commands.
The export output format can be yaml (Kubernetes client intents files) and json.
The following shows the CLI output filtered for the namespace (otterize-tutorial-istio-mapping) of the example above.
Note the HTTP-level details in the list and export results. For example, the exported client intents YAML files contain specific path and method information for each intended call.
- Image
- List
- Export as intents
- Export as JSON
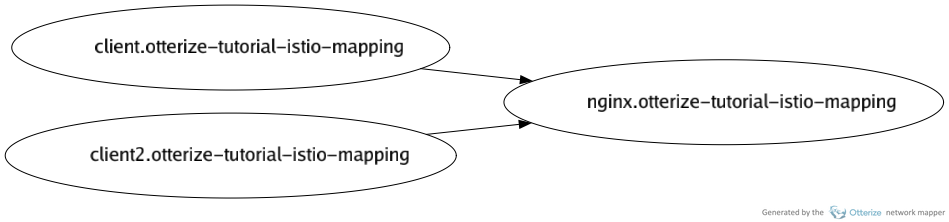
Visualize the overall pod-to-pod network map built up so far, as an image. Note that this image is actually built from information from the network mapper's sniffer (based on DNS requests and open TCP connections), and does not require the Istio watcher (which only supplies fine-grained, HTTP-level information). To retrieve HTTP-level information, use the
listorexportcommands.otterize network-mapper visualize -n otterize-tutorial-istio-mapping -o otterize-tutorial-istio-map.pngFor the simple example above, you should get an image file that looks like:
List the pod-to-pod network map built up so far:
otterize network-mapper list -n otterize-tutorial-istio-mappingFor the simple example above, you should see:
 client in namespace otterize-tutorial-istio-mapping calls:
   - nginx in namespace otterize-tutorial-istio-mapping
     - path /client-path, methods: [GET]
 client2 in namespace otterize-tutorial-istio-mapping calls:
   - nginx in namespace otterize-tutorial-istio-mapping
     - path /client2-path, methods: [POST]
Repeating lines showing calls to common services like
prometheusorjaegerwere omitted for simplicity.
Export as YAML client intents (the default format) the pod-to-pod network map built up so far:
otterize network-mapper export -n otterize-tutorial-istio-mappingFor the simple example above, you should see (concatenated into one YAML file):
apiVersion: k8s.otterize.com/v2beta1
   kind: ClientIntents
metadata:
  name: client
  namespace: otterize-tutorial-istio-mapping
spec:
  workload:
    name: client
    kind: Deployment
  targets:
    - service:
      name: nginx
      http:
        - path: /client-path
          methods: [GET]
---
apiVersion: k8s.otterize.com/v2beta1
kind: ClientIntents
metadata:
  name: client2
  namespace: otterize-tutorial-istio-mapping
spec:
  workload:
    name: client2
    kind: Deployment
  targets:
    - service:
        name: nginx
        http:
          - path: /client2-path
            methods: [POST]
Export as JSON the pod-to-pod network map built up so far:
otterize network-mapper export -n otterize-tutorial-istio-mapping --format jsonFor the simple example above, you should see:
[
  {
    "kind": "ClientIntents",
    "apiVersion": "k8s.otterize.com/v2beta1",
    "metadata": {
      "name": "client",
      "namespace": "otterize-tutorial-istio-mapping"
    },
    "spec": {
      "workload": {
        "name": "client",
        "kind": "Deployment"
      },
      "targets": [
        {
          "service": {
            "name": "nginx"
            "http": [
              {
                "path": "/client-path",
                "methods": ["GET"]
              }
            ]
          },
        },
      ]
    }
  },
  {
    "kind": "ClientIntents",
    "apiVersion": "k8s.otterize.com/v2beta1",
    "metadata": {
      "name": "client2",
      "namespace": "otterize-tutorial-istio-mapping"
    },
    "spec": {
      "workload": {
        "name": "client2",
        "kind": "Deployment"
      },
      "targets": [
        {
          "service": {
            "name": "nginx"
             "http": [
                {
                  "path": "/client2-path",
                  "methods": ["POST"]
                }
             ]
          }
        }
      ]
    }
  }
]
Show the access graph in Otterize Cloud
You can now see the access graph in your browser:
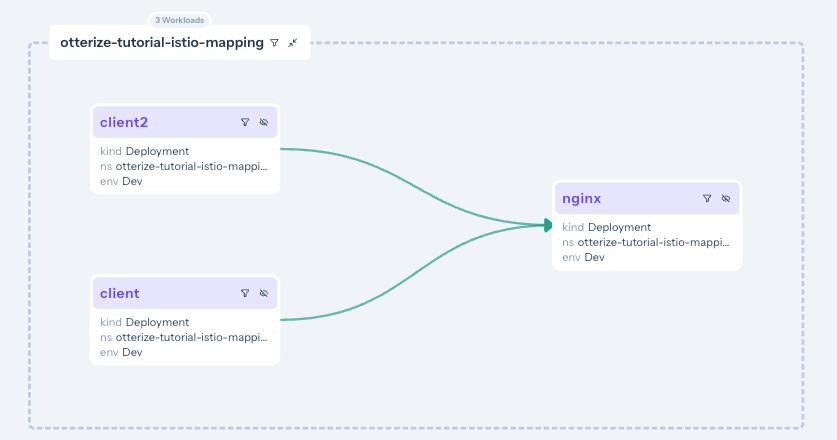
Note, for example, that the client → nginx arrow is yellow. Clicking on it shows:
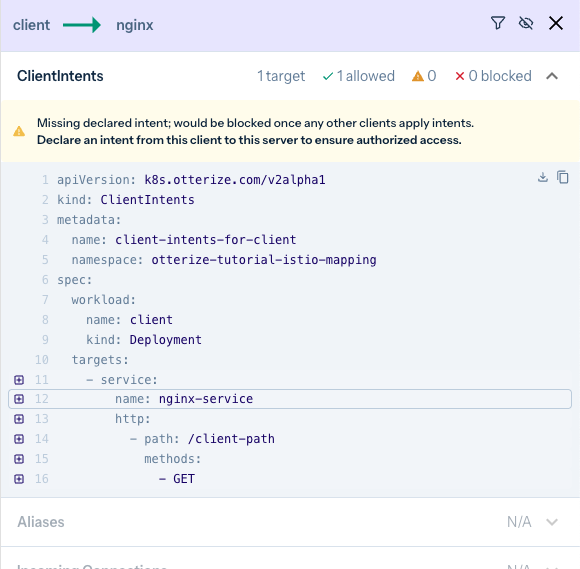
The access graph reveals several types of information and insights, such as:
- Seeing the network map for different clusters, seeing the subset of the map for a given namespace, or even — according to how you've mapped namespaces to environments — seeing the subset of the map for a specific environment.
- Revealing detailed HTTP-level information about the calls being made (e.g.
GETto/client-path), as reported by the Istio watcher. - Filtering the map to include recently-seen traffic, since some date in the past. That way you can eliminate calls that are no longer relevant, without having to reset the network mapper and start building a new map.
- Showing more specifics about access, if the intents operator is also connected: understand which workloads are protected or would be protected, and which client calls are being blocked or would be blocked. We'll see more of that in the Istio AuthorizationPolicy tutorial.
What's next
The network mapper is a great way to bootstrap IBAC. It generates client intents files that reflect the current topology of your workloads; those can then be used by each client team to grant them easy and secure access to the workloads they need, and as their needs evolve, they need only evolve the intents files. We'll see more of that below.
Where to go next?
- Learn how to roll out Istio authorization-policy-based access control using intents.
- If you haven't already, see the automate network policies tutorial.
- Or go to the next tutorial to automate secure access for Kafka.
Teardown
To remove Istio and the deployed examples run:
helm uninstall istio-base -n istio-system
helm uninstall istiod -n istio-system
kubectl delete namespace otterize-tutorial-istio-mapping